Welcome to the first of the blog series I am writing on Azure Synapse Analytics. As you know Azure Synapse Analytics went GA end of 2020, and in the following blogposts I would like to walk you through the out-of-the-box capabilities you have to report easily on a vast dataset.
Azure Synapse Analytics Series:
- Azure Synapse Analytics – Serverless SQL Pools
- Azure Synapse Analytics – Serverless SQL Pools: Partitioning
- Azure Synapse Analytics – Serverless SQL Pools: Data Elimination
Serverless SQL Pools allows you to build a logical structure on your files hosted in Azure Data Lake and query them directly, in this blogpost I will be showing you how to create that structure and how to report on this structure with Power BI.
Setting the stage
First things first, I downloaded the TLC yellow taxi dataset from 2010 until 2020 and converted this from CSV to Parquet. I pushed these parquet files in one folder. This did require some cleaning, so please do not hesitate to leave a comment if you want to have access to the cleansed set to test these things out yourself!
|
SELECT |
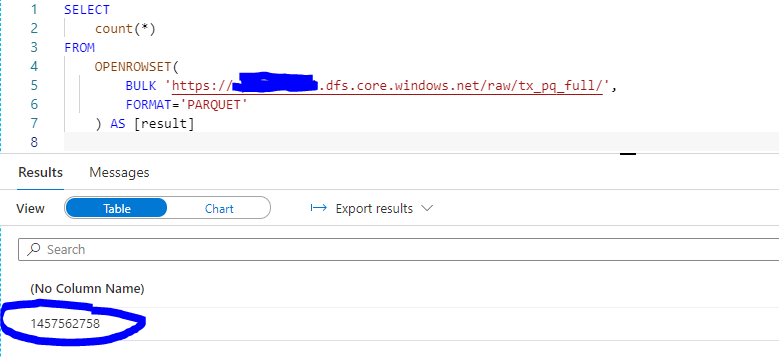
In the image below you can see the count I did using Serverless SQL Pools in my Azure Synapse Studio. The set we are working with has more than 1.4 billion rows!
Creating a logical structure
I will start of by creating a logical structure for the parquet files which are in the folder.
The easiest way to get started with this, is by querying this data set with openrowset. This way you can explore your data and see what is in it. Openrowset supports CSV and parquet files, in this case we are using parquet files.
Let’s start off by doing a “select top 100 *” to see what the data looks like. In Synapse Studio, I navigate to the Data tab. In the Data tab I will click on linked services and select the Azure Data Lake which contains the folder with all the data. I will then open the folder hosting the parquet files and right click one of the files.
I will then hover over New SQL Script then it gives us the option to do a select top 100 *. By clicking this, it will provide you with the syntax you need to select data from that specific file.

This is the code that will be generated:
|
SELECT |
This however will only select data from that one parquet file while we would like to do this on the full set of data in that folder. To query the full folder, we remove the XXX.snappy.parquet at the end or we specify the * wildcard instead of XXX.
|
SELECT OR SELECT |
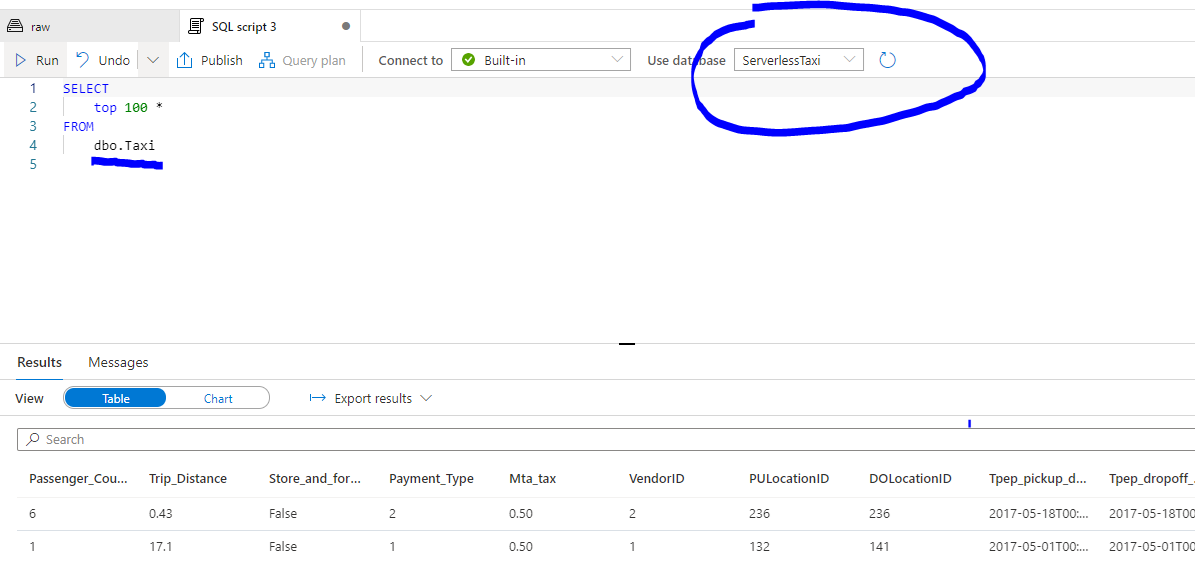
In the image below you can see that we will fetch the first 100 rows from the full dataset.

As we now are able to select on the folder, we can persist this query into a view to endure it in a logical structure. This way I can just specify the view instead of specifying the openrowset with the folder structure.
To start creating this logical structure, we will first need to create a database and in that database we can then specify the view referencing the openrowset query. This new view will be used in the Power BI report later on.
(Next to this you also have the option to create an external table on external files to generate your logical structure: more information https://docs.microsoft.com/en-us/azure/synapse-analytics/sql/create-use-external-tables)
|
CREATE DATABASE ServerlessTaxi |
The statement above will create the following database with the following view
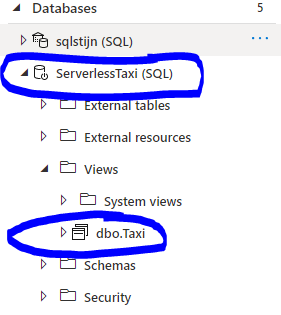
From here on we can use the view to query the data.
We will use this view to start building a report in Power BI.
Building a report
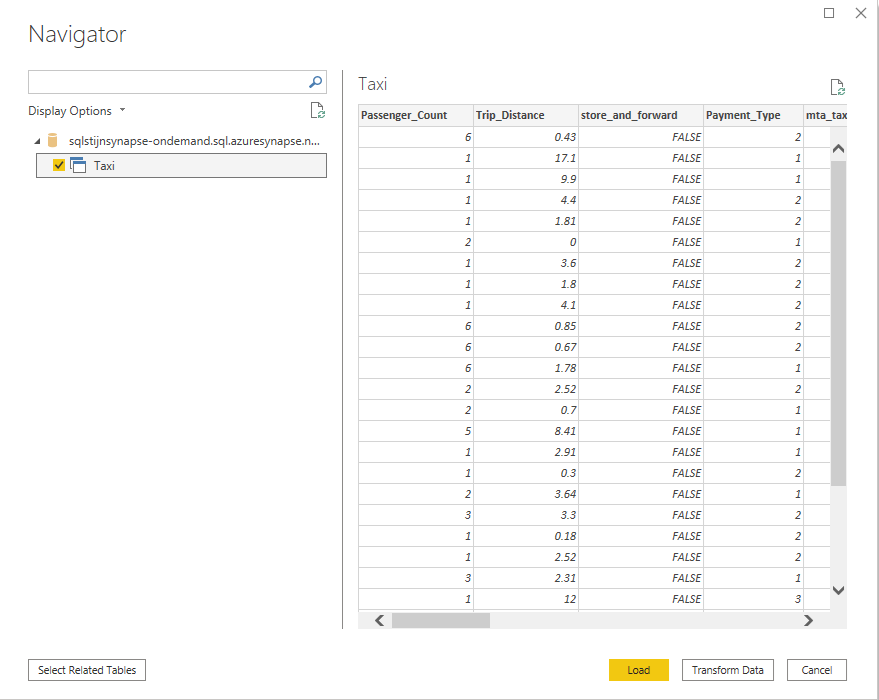
Open Power BI and click on get data. As Serverless SQL Pools have a SQL Endpoint, you can specify SQL Server and connect to your Serverless SQL Endpoint (You can find this in the overview page of the synapse workspace in the azure portal)
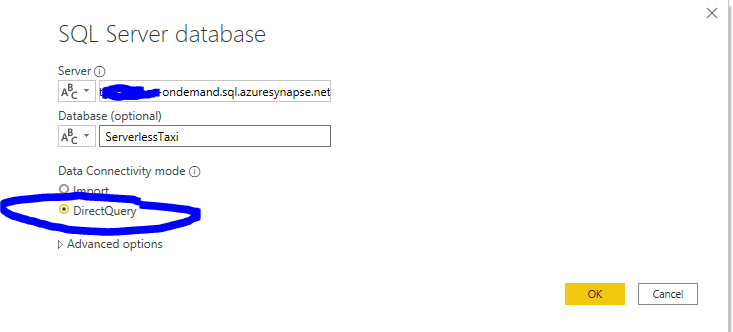
We will be using the ServerlessTaxi database we created and as you can see below, we see the Taxi View we created. As we are building a report on 1.4Billion rows, we should use Direct Query instead of import!
After this I created a simple report and looked at the performance analysis to see how this report is performing on this huge dataset
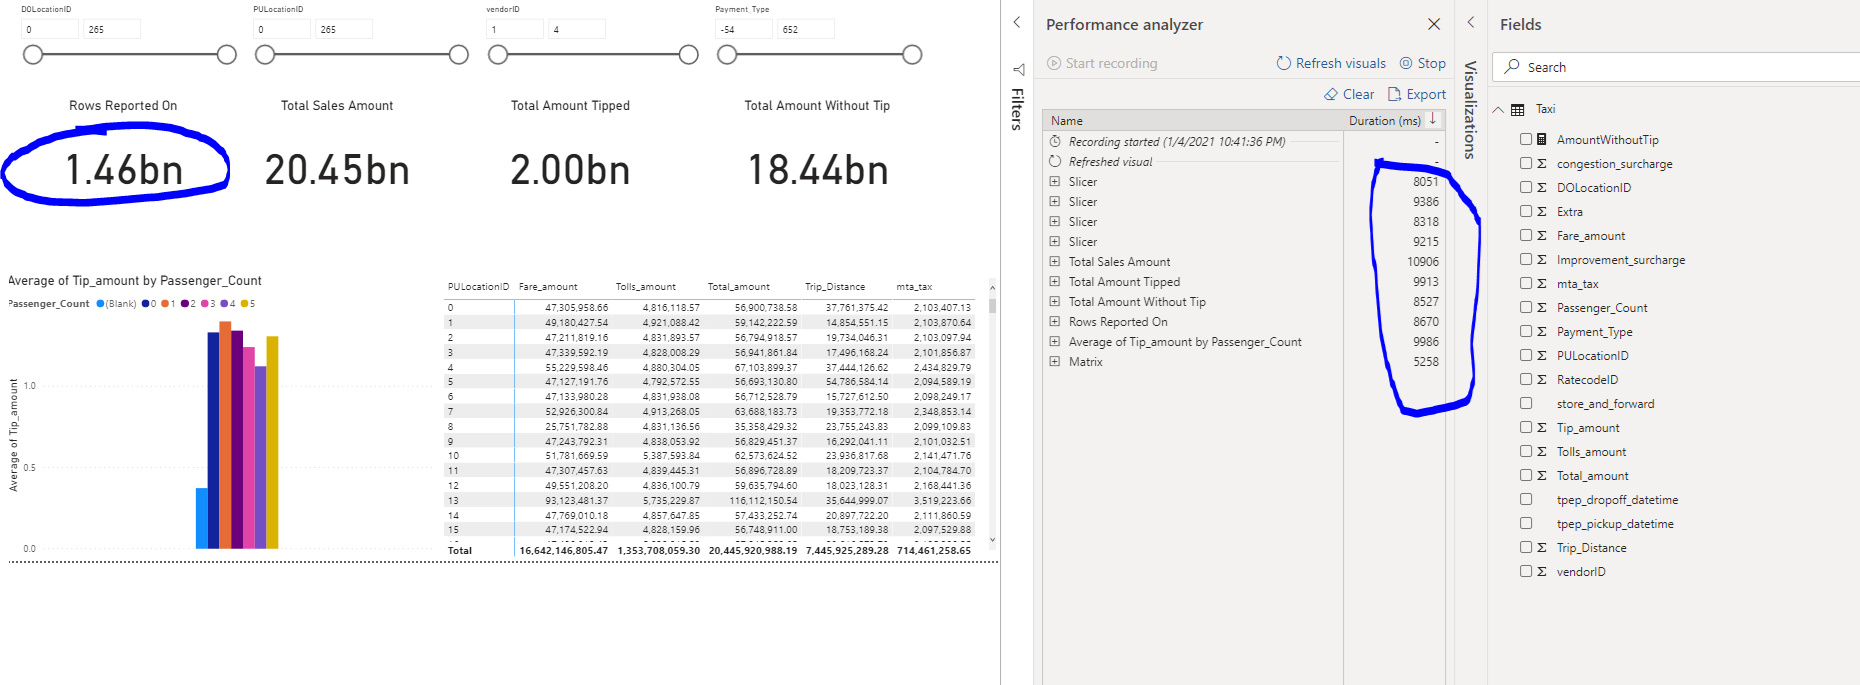
I created a few card’s which include a calculation, added some slicers and a matrix representing some sales by locationID. This report is on +1.4 Billion rows and the slowest card which is the Total Sales amount gives its result back in less than 11 seconds. Yes, you are reading this correctly, IN LESS THAN 11 SECONDS ON 1.4 BILLION ROWS OUT OF THE BOX!
This just shows you the power that is behind the Serverless SQL Pools, it can generate quick insights on very large datasets all in native SQL.
Now there must be a downside to this, the one thing that pops to mind is the cost of the solution.
You will need to watch out with the number of queries that you are doing and the amount of data you are processing in those queries. In Serverless SQL Pools your cost is based on the amount of data you process. There is a great blogpost elaborating on Serverless SQL Pools costs by Nikola Ilic which you can find here https://data-mozart.com/cost-control-in-synapse-analytics-serverless-sql-easy-way/.
To reduce costs and increase performance, you can optimize the queries and the amount of data that will be processed. And this is exactly what I will be showing you in the next blogpost of this series!
Summary
Serverless SQL Pools give you an easy and fast way to start reporting and exploring your data on very large datasets. You do not have to load and transform your data and put them in a relational structure, with Serverless SQL Pools you can create your own logical structure using openrowset views and external tables referencing the files directly. When you have created your own logical structure, you can then query it in SQL. Serverless SQL Pools allows us to report on huge datasets in seconds and opens a whole new world of opportunities when analyzing and reporting on your data.
In the next blog post, I will be showing you a bit more on how Serverless SQL Pools interact with the underlying parquet layer and how you can optimize your queries both on performance and cost.
![]()