Background
I am learning Spark Pools which is one of the newest features of Azure Synapse. If you are new also, I hope you join me on this journey! Let’s start small and with something that many people will want to do. We will read a CSV file that is stored in Azure Data Lake Store Gen 2.
Getting into a Spark Notebook
When you setup your Synapse Workspace via the Portal, it guides you through creating a storage account that is linked for you (including permissions to access it from Spark Pools). If you want to read more about how to do this manually, here is a link to documentation on how to configure access for Synapse Spark to Azure Data Lake Store Gen 2: Introduction to Microsoft Spark utilities – Azure Synapse Analytics | Microsoft Docs
I’m going to assume that you have created a Synapse Workspace with a Spark Pool. I also assume you have a storage account and its access is linked. Lastly, you will need a CSV file sitting in a container.
So now, let’s go to the Synapse Analytics Studio!
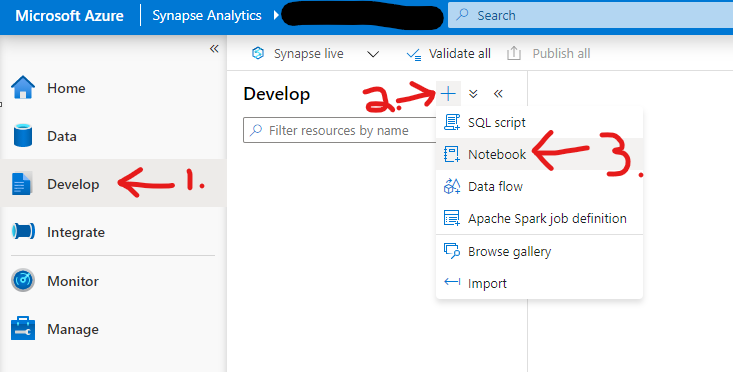
From the main screen of the Synapse Analytics Studio, click on “Develop. On the next screen click on the “+” beside Develop and choose “Notebook”.
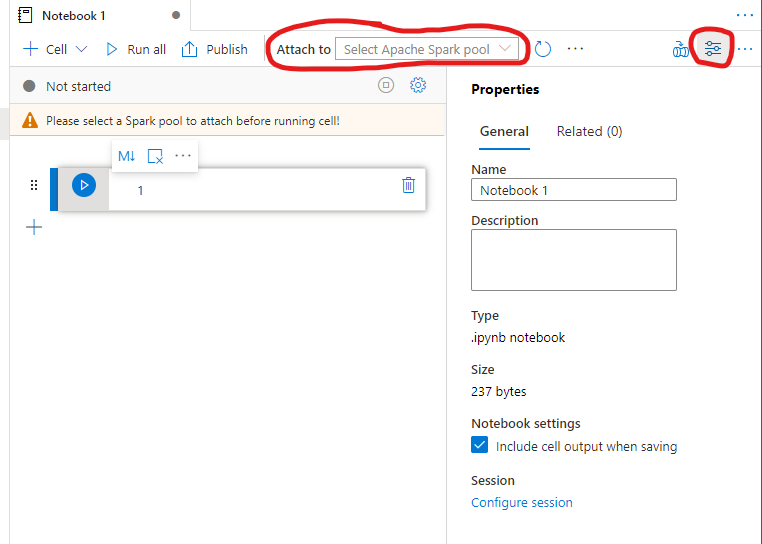
To clean up our screen, you can collapse the right-hand side Properties Pane. You can do this by clicking on the second from the right icon just above the pane. I’ve circled in the below screenshot.
Next, you will want to click on the drop down for “Attach to” and select your Spark Pool.
Reading a CSV File
In our code block, let’s use this template:
from pyspark.sql import SparkSession

from pyspark.sql.types import *
account_name = "Your account name"

container_name = "Your container name"

relative_path = "Your path"
adls_path = 'abfss://%s@%s.dfs.core.windows.net/%s' % (container_name, account_name, relative_path)
dataframe1 = spark.read.option('header', 'true') \

.option('delimiter', ',') \

.csv(adls_path + '/FileName.csv')
dataframe1.show()
This code is in Python, or PySpark. First, we create an object of SparkSession to hold the path to the CSV file. Next, we create a data frame and then select the top 20 records from the data frame.
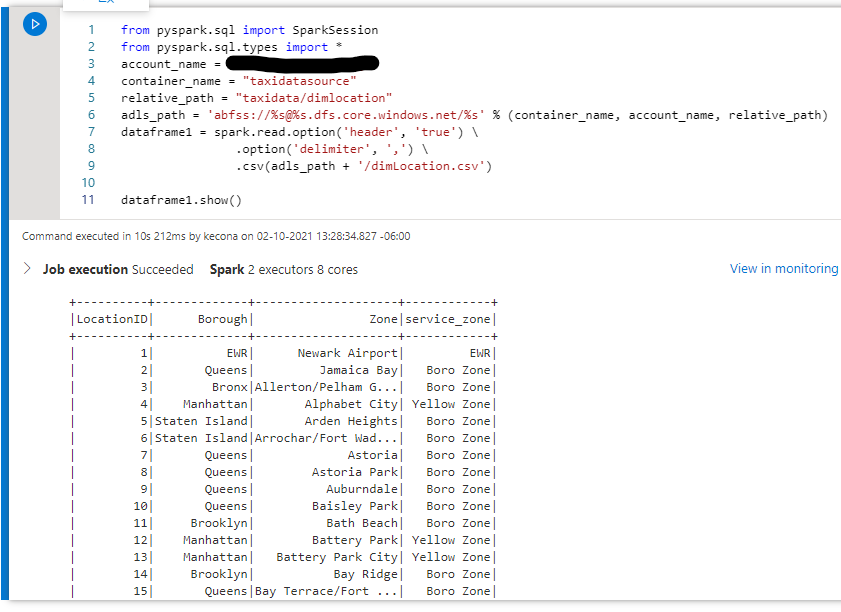
I’m going to populate the above template to use one of the NY Taxi Data’s dimension CSV files in my data lake. Next, I will click on the blue play button on the left side of the code block to execute the code.
Please note that if this is the first code being run in a while, the spark cluster might need to start. Starting a Spark Pool can can take a few minutes.
Here is what my code block looks like and what my output looks like:
Conclusion and Further Reading
Now that we have the CSV file in a data frame! With a data frame, we can filter the data, transform it and write it back out to a data lake or database.
Here is the link to documentation that helped me out – Synapse Studio notebooks – Azure Synapse Analytics | Microsoft Docs
If you prefer C#, here is some documentation for doing this with C# – Introduction to Microsoft Spark utilities – Azure Synapse Analytics | Microsoft Docs
![]()