Background
It’s time for us to take our next step in our Synapse Spark Journey. Today, we’re going to play with Data Frames. Data Frames are where our data is temporarily stored within Spark. Like last time, we are going to focus on using Python.
Setup
For our examples, we will build off from what we learned previously about reading a .CSV file into a data frame.
For my examples, I’m going to be using one of the New York Taxi sample data dimension files (dimlocation.csv).
So, let’s go ahead and read in a file using this code template:
from pyspark.sql import SparkSession

from pyspark.sql.types import *
account_name = "Your account name"

container_name = "Your container name"

relative_path = "Your path"
adls_path = 'abfss://%s@%s.dfs.core.windows.net/%s' % (container_name, account_name, relative_path)
dataframe1 = spark.read.option('header', 'true') \

.option('delimiter', ',') \

.csv(adls_path + '/FileName.csv')
dataframe1.show()
Remember, the first-time running Spark code will take longer as the pool has to start up.
So Many Demos!
Let’s begin with seeing what the schema is for data frame:
dataframe1.printSchema()

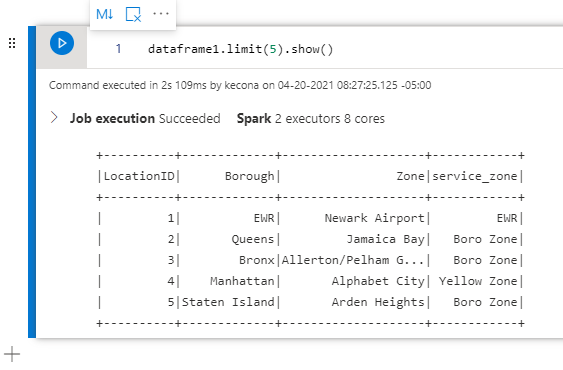
Now that we know the schema, let’s return the first 5 records:
dataframe1.limit(5).show()
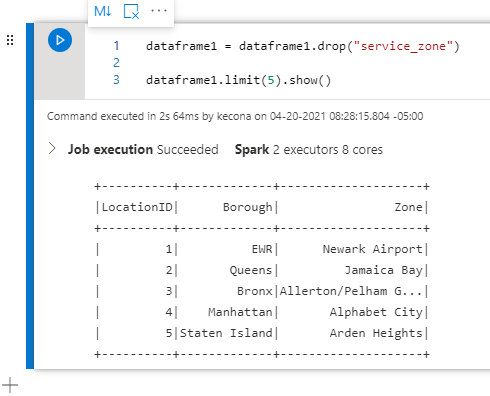
Next, let’s assume that we do not need to include the service_zone. So let’s drop it to clean up our data frame a bit. We will also display the first 5 records again to see the difference:
dataframe1 = dataframe1.drop("service_zone")
dataframe1.limit(5).show()
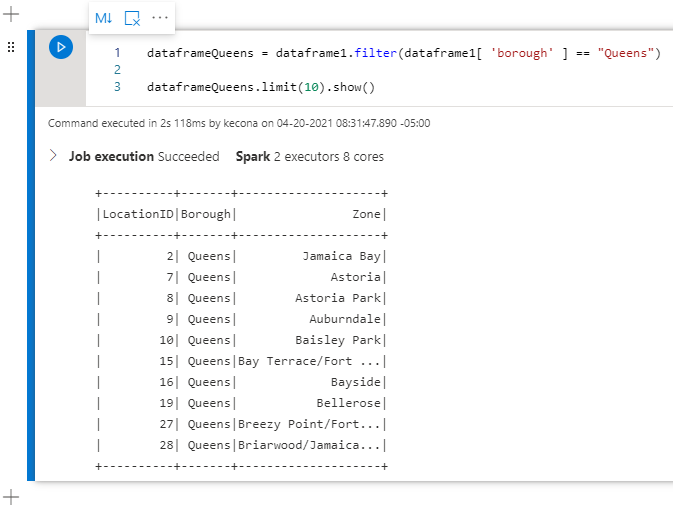
Let’s create a new data frame that just has the records where the Borough is Queens and return the first 10 records:
dataframeQueens = dataframe1.filter(dataframe1[ 'borough' ] == "Queens")
dataframeQueens.limit(10).show()
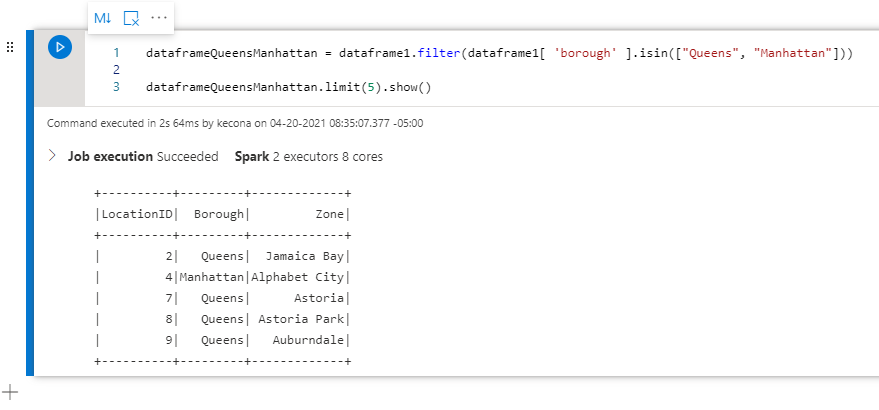
What if we want more than one Borough? No problem! Let’s look at using “isin”:
dataframeQueensManhattan = dataframe1.filter(dataframe1[ 'borough' ].isin(["Queens", "Manhattan"]))
dataframeQueensManhattan.limit(5).show()
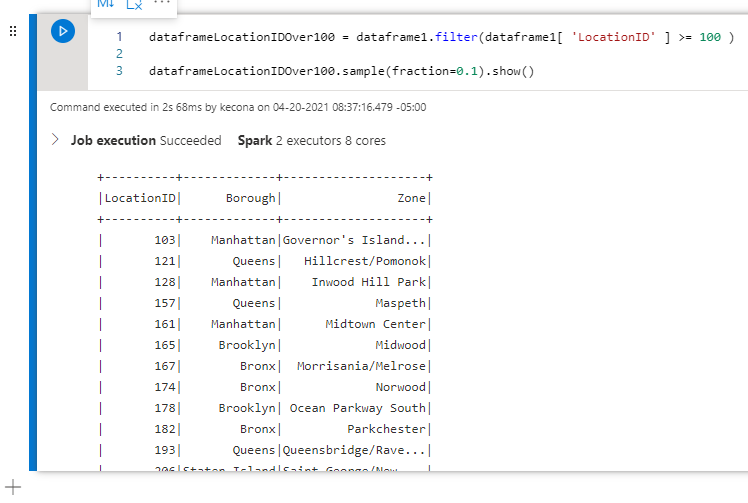
 Now that we are getting the hang of this, let’s try two new things! First, let’s create a new data frame that contains only records where the LocationID is 100 or higher. Next, let’s return 10% of the records.
dataframeLocationIDOver100 = dataframe1.filter(dataframe1[ 'LocationID' ] >= 100 )
dataframeLocationIDOver100.sample(fraction=0.1).show()
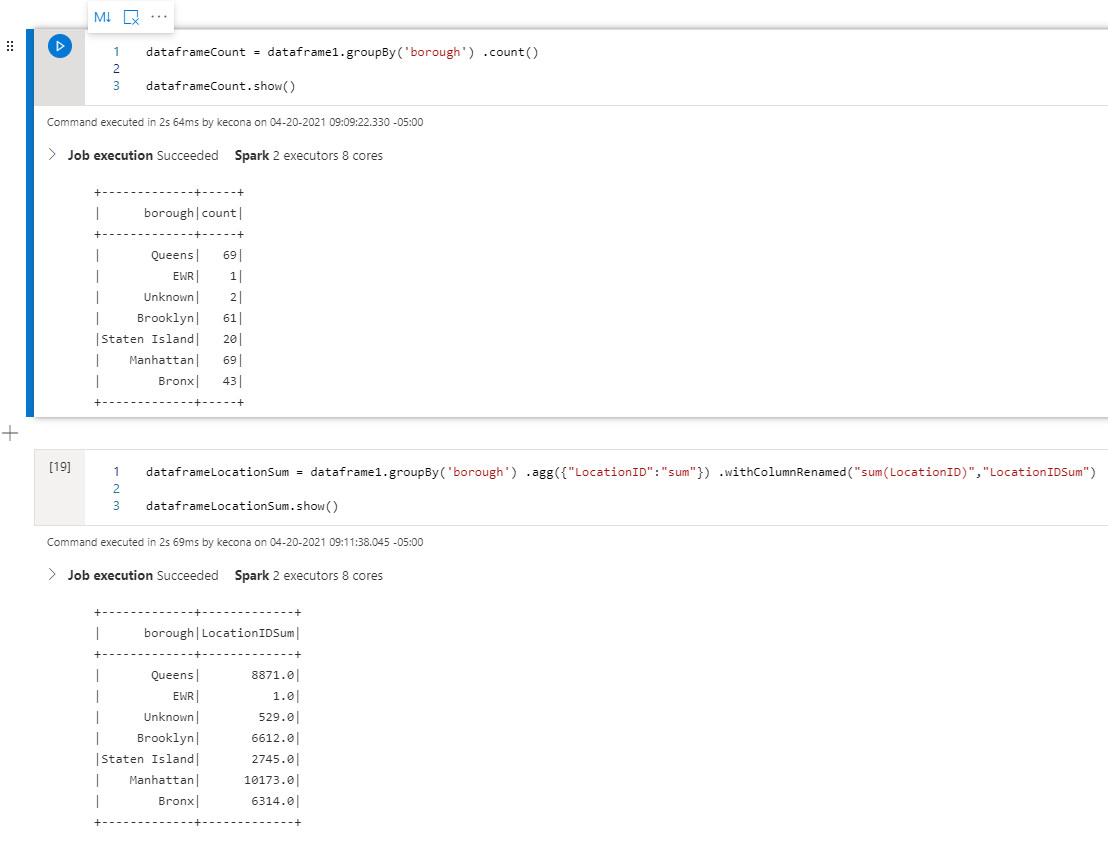
 For our last example today, let’s look at two things. The first is using Count with a GroupBy. Next, we’ll use Sum with a GroupBy and rename one of the columns:
dataframeCount = dataframe1.groupBy('borough') .count()
dataframeCount.show()
dataframeLocationSum = dataframe1.groupBy('borough') .agg({"LocationID":"sum"}) .withColumnRenamed("sum(LocationID)","LocationIDSum")
dataframeLocationSum.show()
Conclusion
At this point, you might be wondering why we keep creating new data frames when we are selecting only some of the data. The reason is that Spark leverages something called Lazy Evaluation. That means that Spark will not actually create these new data frames until the data is returned (with a show statement or written to a file/database). Spark keeps track of all the transformations and only when it needs to execute them, does so.
This means that we need to separate the transformation step from the display/return step. There are some exceptions like we saw when we dropped a column from the data frame. The idea is to keep our transformations of the original data frame isolated so that other Spark Jobs can also do any transformations they need from the same source data frame with impacting each other.
With that, let’s stop here for today. Next time, we’ll look at creating a sub function that uses arrays and creates a bar chart!
![]()